Quantcast
Viewing all 369 articles
Browse latest View live

Nutanix – Web-Scale Converged Infrastructure

The entire world’s IT infrastructure  is driving towards the virtualization to reduce the IT costs by consolidating the small and mid-range workload environments. When it comes to Virtualization, hypervisors are ruling the market and VMware is top among those. Microsoft Hyper-V,Oracle VM for X86 and Redhat Enterprise  Virtualization(RHEV) also competing with each other on the hypervisor market along with VMware. Now the questions is that how to reduce the IT cost further in hypervisor virtualization  ?

Typical Virtualization environments consists (Ex: VMware vSphere ), We need X86 Physical server , Shared storage  and networks.From these components ,we can easily say that shared storage is the costliest and it requires the specialized FC network to get the performance.  Is it possible to eliminate the shared storage on the hypervisor Virtualization ?. Yes. We can. Please check out the below options.

  1. VMware vSAN
  2. Nutanix

Why Nutanix ? Why not VMware VSAN ?

In VMware SAN , you can’t extend the VSAN container to other compute clusters, and you can only have one container per compute cluster(See the below image).Depending on vSphere and application licensing (e.g., databases), VSAN can potentially create silos of capacity and performance.

                                             VMware VSAN

Image may be NSFW.
Clik here to view.
VSAN


Nutanix, on the other hand, is not bound to a vSphere compute cluster. So while you could architect a solution similar to VSAN, you have the choice to create one large storage clusters – regardless of licensing of the compute layer.

                               Nutanix

Image may be NSFW.
Clik here to view.
Nutanix


Nutanix delivers the web-scale-IT which is not new to the world but its new but its new to the enterprise IT. Google and Facebook internet giants are already using the web-scale IT where they can add the capacity on demand without additional configuration on the new X86 boxes. These web-scale environment can grow without any limits with very low cost of ownership.

How Nutanix’s Web-Scale IT is different from traditional infrastructure architecture ?

Traditional VMware vSphere environment will be look like below if we use FC SAN.It normally consists the X86 servers ,Network switch,Routers ,FC switches and Storage.

FC-SAN

Image Source: thehyperadvisor.com

CONVERGED:(Storage Network & Network will be combined)

If we use the iSCSI storage , our environment will look like below . In this architecture ,we are completely eliminating the FC network and FC switches .

Image may be NSFW.
Clik here to view.
ISCSI ENV-NEW


Image Source: thehyperadvisor.com

Hyper-Converged:(Nutanix’s)

The below image shows that how the Nutanix’s Hyper-Converged environment looks.

Image Source: thehyperadvisor.com

What  Nutanix appliance consists ?

Nutanix appliance consists standard X86 server  with hard-drives(HDD) and  Solid State drives (SSD).The storage capacity and server configuration differs for each model.It eliminates the FC SAN or ISCSI storage by utilizing the local storage .It can match the FC SAN performance by using the SSD as cache.Hyper-convergence reduces the datacenter space significantly and reduces the power consumption as well.

How can we scale the IT infrastructure using the Nutanix appliance ?

Using the Nutanix intelligent software, we can the scale the IT infrastructure easily as needed.  These web-scale systems are 100% software defined and no reliance on hardware for resilience and performance. New functions or features  can be added to the without any hardware upgrades.

Image may be NSFW.
Clik here to view.
software defined 8x Faster

How Nutanix works ?

Nutanix software distributes the data ,metadata and operations across the entire cluster without any bottlenecks in the control paths. The environment can grow without any limits.The Nutanix Distributed Filesystem (NDFS) is at the core of the Nutanix Virtual Computing Platform. It manages all metadata and data, as well as enables all core features. NDFS is the software-driven architecture that connects storage, compute resources, controller VM, and the hypervisor.

Image may be NSFW.
Clik here to view.
Software Distributed Everything

Nutanix’s Availability:

web-scale IT systems are built for an “Always On Operations” . It  has automatic self healing mechanism which helps to  recover quickly from the individual components failures without degrading application and data availability. It also reduces the total operating cost by 40% .

Image may be NSFW.
Clik here to view.
self healing system

Nutanix also supports the de-duplication, compression, thin provisioning ,snapshots ,clones and advanced data protection. We easily start with low end systems and easy to add on demand basis. Nutanix supports VMware vSphere , Microsoft’s Hyper-V and Redhat’s RHEV .

Nutanix Architecture:

Image may be NSFW.
Clik here to view.
Nutanix ENV


Hope this article may shed some light on the Nutanix .  Share it ! Comment it !! Be Sociable !!!

The post Nutanix – Web-Scale Converged Infrastructure appeared first on UnixArena.


vCenter Operations Manager 5.8 Overview – Part1

VMware offers vC Ops “aka”  vCenter Operations Manager to monitor VMware vSphere and vCloud environments in the most efficient way.It provides the great visibility on VMware infrastructure to the system administrators and stake holders.The most important feature of vC Ops is capacity planning.It projects the resource consumption growth with help of the historical statistics. VMware vSphere itself  provides the necessary performance chart for each VM and ESXi’s resource consumption. Then why do we still need vCenter Operations Manager ? How different it is ? VMware vCenter’s monitoring system is just restricted to its own VM’s and hypervisors.But vC Ops can able to monitor multiple vCenter servers and provides the great visibility to the system administrators about the whole virtual IT infrastructure. .

The vC OPs Dashboard provides the three important things about the virtual infrastructure  environment.  The first thing is  health of the each VM’s and ESXi servers.Using the colour  codes, we easily navigate to the VM/ESXi which is in high risk(Green-Normal , Yellow=Information, Red=Action Required). The second things is about “Risk” . The vC OPs predict the future issues by calculating the historical data. For an example, XYZ  datastore’s data size is increasing everyday rapidly. vC OPs will predict that if this datastore usages goes for next 7 days , it will get full and those kind of updates will be shown on “RISK” column.The third one is about the efficiency of the environment. Please see the below screenshot of vC OPS dashboard.

Image may be NSFW.
Clik here to view.
VCOPS dashboard1


License:

vCOps has four edition. Based on your requirement , you need to purchase the license for this product.

  • Standard – vSphere performance and basic notifications
  • Advanced – as above features +  capacity management
  • Enterprise – as above features  + chargeback, reporting and advanced alerting, and configuration management
  • Enterprise plus – as above feature + enhanced configuration management and extensibility (third party plugins, customizable dashboards etc…)

Resource Requirement:

vCOps require huge storage since it needs to store the historical performance data for each VM and ESXi servers.

Environment SizeMemoryCPUStorageIOPS
Small (up to 1500 VMs)16GB RAM4 vCPUs900GB1500+
Medium (1500 – 3000 VMs)25GB RAM8 vCPUs1.8TB3000+
Large – (3000+ VMs)34GB RAM16 vCPUs3.6TB6000+


vCOps Monitoring vs VMware vCenter Monitoring:

This is an small example to prove that how vCOps is different from inbuilt-VMware vCenter Monitoring. For an example , You have one specific VM which runs batch jobs at 12 AM mid-night and during that time CPU usage goes beyond the 85% everyday. In VMware vCenter, you have configured the CPU threshold  as 80%. So everyday vCenter triggers critical alert due to the batch at mid-night. When you use the vCOps, it will not trigger the critical alarm since it actually learns our environment and this is normal behaviour of this environment. But it will not forget to update the VM status on the dashboard.

How vC OPs reduce the troubleshooting time ?

When its comes to performance issue, it is very difficult to troubleshoot.If we do not have historical performance  data for the ESXi or VM, it is very difficult to tell what was the normal state. But when you use vC Ops , it will tell you that what was the normal resource consumption of the VM or Host .It will be indicated using the “Blue brackets” (See below image) and the current usage is displaying using the green bar.

Image may be NSFW.
Clik here to view.
Workload VM


Intermediate VM issue also make you mad sometimes. Application team may be complaining about this VM that application/DB crashes frequently on this host. As VMware System administrator, you need to find out that what is happening in the VM at the time of DB/APP crashes. vC Ops will help you to identify that how much time VMware was running out of the resources and recommended resource for this VM. It also collects the logs and VM events.

If you integrate with VMware vCenter configuration manager, you can easily track the changes of each VM.

vSphere Objects Relationship:

vCOps provides the great view of the objects that has direct relationship with object which you have selected.

Image may be NSFW.
Clik here to view.
Relationship-VM objects


Capacity Planning:

In vCOps portal, You can get lot of information about capacity planning under “Planning” and “Analysis” tab. With the help of historical data , vCOps can easily figure out the resource , when it might be ran out off space.

What’s New on vCOps 5.8 ?

According to the VMware notes, vCOps 5.8 has ,

  • Optimized query execution to improve performance at scale.
  • Enhanced authentication options with new active directory integration for authentication.
  • Improved security with upgrades to the OS and runtime environment.
  • New integration with VMware vCenter Log Insight using a vCenter Operations Manager Content Pack that enables you to monitor your vCenter Operations Manager infrastructure.
  • Expanded integration with vCenter Hyperic using the vCenter Operations Management Pack for vCenter Hyperic. This management pack provides many new capabilities, such as:
    • Support for Microsoft Hyper-V servers, including out of the box dashboards for troubleshooting and performance analysis.
    • Support for Microsoft Exchange and SQL Servers, with out of the box dashboards for troubleshooting.

In the next article,we will see how to deploy the VMware Operation Manager on VMware vSphere environment.

Do not forget to check out VMturbo Operation Manager 5.0.

The post vCenter Operations Manager 5.8 Overview – Part1 appeared first on UnixArena.

Creating Network profile for vC Ops 5.8 – Part 2

In this article ,we will see that how to configure the network protocol profile for vC Ops vApps using vSphere web-client. Network protocol profiles provide a network identity to vApps. A network protocol profile is a pre-defined network configuration that is assigned to a network used by a vApps. The vApp can then leverage vCenter Server to automatically provide an IP configuration to its virtual machines. vC Ops OVF file contains “Analytical VM” and “User interface VM” vApps. We need to set the static IP address for both VM’s but however network profiles are mandatory to power on these vApps. Let’s see how we can create network protocol profile for vC Ops vApps.

1. Login to the vSphere web Client .

2.Click on the Networking .

Image may be NSFW.
Clik here to view.
VMware vSphere - Networking1

3.Select the Network in which you want to configure the vC Ops network profile.

4.Click on Manage and Select Network Protocol Profile.Click on the Link icon which is on the right side.

5.If you click the link icon, new wizard  will pop-up like below.Select “Create a new Network protocol profile”  and click next to continue.

Image may be NSFW.
Clik here to view.
Network Protocol Profile creation

Network Protocol Profile creation

6.Enter the network name and select the network which you want to associate with this profile.  Click Next to continue.

7.Enter the network information according to your requirement.

Image may be NSFW.
Clik here to view.
Enter the IPV4 Network information

Enter the IPV4 Network information

You can restrict the network profile to use to specific range of IP address by enabling the network pool. In our case,we are going to set the static IPs for vC Ops vApps . So do not enable the “IP pool”

8.You can skip IPV6 if you are not using it.

9.Set the other network configuration according to your environment.

Image may be NSFW.
Clik here to view.
Enter the DNS servers and Domain Names

Enter the DNS servers and Domain Names

I have left blank since I do not have DNS servers configured on my test environment.

10.Review your settings and Click finish to create a new network protocol profile.

11. We can see that new network protocol profile has been created successfully.

This profile will be used when we are going to deploy the vC Ops which we have downloaded from VMware.

In the next article ,we will see that how to deploy the vC Ops.

The post Creating Network profile for vC Ops 5.8 – Part 2 appeared first on UnixArena.

Deploying vCenter Operation Manager 5.8 – Part 3

VMware provides the vC Ops installable software for windows & Linux.VMware also provides the pre-configured vApps to deploy vCenter Operation manager in few clicks and this will be the most common method. If you plan to install it on Linux or Windows hosts, you need to buy license for operating systems  along with vC Ops. But when you deploy vC Ops as appliance (vApps) , you just need to buy license for vC Ops only. vC Ops comes as bundle of “Analytical VM” and “User interface VM”. Analytical VM is responsible to collect the performance matrix data and stores using the PostgreSQL database. User can directly access the “User interface VM ‘aka’ UI VM”   to retrieve the necessary information from analytical VM.

To know the system requirements for vCOps , Check the Part 1.

Before deploying the vCOps , you  need to configure the IP Pools for vCops on the VMware vSphere networking.Check it in Part 2.

1.Download the VMware-vcops-5.8.4.0-2199700-vapp.ova from VMware website. VMware provides 60 days trial for this product.

2.Login to vSphere Client and navigate it hosts and cluster.

Image may be NSFW.
Clik here to view.
Login to vSphere-Web-Client

Login to vSphere-Web-Client

3.Right click the datacenter and select “Deploy OVF Template” .

4.Browse the OVA file location and select the vC Ops OVA file.

5.Review the OVF template details.

6. Accept the end user license agreement and click on next.

Image may be NSFW.
Clik here to view.
Accept the End user License Agreement

Accept the End user License Agreement

7.Enter the vApps Name and select the datacenter or folder where you would like to deploy.

Image may be NSFW.
Clik here to view.
Enter the Name and Select the Data-centre

Enter the Name and Select the Data-centre

8.Select the configuration type according to the environment size. “Small” configuration can able to monitor up to 1500 VMs.

Image may be NSFW.
Clik here to view.
Select the deployment configuration size

Select the deployment configuration size

9.Select the host in which you would like to deploy the vC Ops vApps . (UI VM & Analytics VM).

10.Select the datastore in which you would to store the vC Ops VM’s.

Image may be NSFW.
Clik here to view.
vC Ops Select storage

Select “Thin Provision” if you do not have enough space to enough space on the datastore for thick provision. VMware recommends to format the virtual disk as thick provision to improve the vC Ops performance.

11.Select the network configuration. We are going to set the static IP for analytical VM and UI VM. So Select “Static-Manual”  in the IP allocation tab. You must provide the DNS servers to deploy the vApps.

12.Select the proper time-zone and set the static IP’s for the both VM in the below screen.

Image may be NSFW.
Clik here to view.
Enter the Static IP for both VM s

Enter the Static IP for both VM s

13. Review the settings prior to proceed with deployment.Click “Finish” to start the deployment.

14. You can see the deployment status on the tasks details tab.

15.Once the deployment is completed, you can see the new vApp and two new VM’s.

Image may be NSFW.
Clik here to view.
vC Ops deployed successfully

vC Ops deployed successfully

We have successfully deployed the vC Ops . In the next article ,we will see the post configuration of vC Ops’s vApps.

Share it ! Comment it !! Be Sociable !!!

The post Deploying vCenter Operation Manager 5.8 – Part 3 appeared first on UnixArena.

Configuring the vCenter Operations Manager 5.8 – Part 4

This article will help you to configure the vCenter Operating Manager 5.8 . Once you have deployed the vC Ops using the OVA file , new vApps will be created along with  two new VM’s. (Analytics VM & UI VM). When you power on the vApps , Analytics VM gets power on and it takes nearly 10 minutes  to initialize. There are plenty of start-up scripts runs to configure the VM to use for first time. Once the Analytics  VM is up , UI VM gets power on and it also has plenty of start-up scripts for first time initialization. Once the both VM’s are up , you can use the UI VM ip address/hostname to access the web-portal to configure the vC Ops. Once you have logged in to the portal using “admin” user account, initial setup wizard pop-ups to perform the configuration.

1. Login to vSphere web-client  and power on the vC Ops ‘s vApps. VM’s will take its own time to initialize for first time.

2.Here is the summary tab of Analytics VM.

3. UI VM summary tab .Click on the Launch console link to open the VM console  for post configuration.

4.VM console will be opened on new browser tab. You will get the UI VM console like below.

vC Ops – User Interface VM username / password : root/vmware , admin/admin.

5. In the above console ,you will get the URL to access the web-portal of UI VM. (Ex: http://192.168.2.50) In new browser tab, access the vC Ops UI – VM web-portal.

6.Once you have logged in on UI VM web-portal , wizard pop-ups for initial configuration.Provide the vCenter details where UI VM & Analytics VM is hosted.

Image may be NSFW.
Clik here to view.
Enter the Appliance - vSphere info

Enter the Appliance’s vShere info

Security alert may pop-ups like below. Just select “yes” to continue.

7.Change the factory default password for users admin and root in the below screen.

8.Enter the vCenter servers details which needs to be monitored using vC Ops.We have also option to specify the Registration user and collector user.

Image may be NSFW.
Clik here to view.
Specify vCenter Server to monitor

Specify vCenter Server to monitor

9.If this is the first time vC Ops installation, then  you can forget about “Import Data”. If you have any historical data from vCenter extension, you can import it here.

10.If you are  connecting your vCenter servers from different sites using vCenter Linked Mode,then you can provide the information on this window.

Click Finish to complete post configuration.

Image may be NSFW.
Clik here to view.
Registering vCenter Server on  vC Ops

Registering vCenter Server on vC Ops

You will get the below window, once you have completed the registration.You can also add the new vCenter Server by clicking the New Registration tab.

Image may be NSFW.
Clik here to view.
vCenter Operating Manager Administration

vCenter Operating Manager Administration

If you are not getting the above page , you can access it using “https://UIVM-IP/admin” URL.

11. Once the registration is complete, You can open a new window to browse the UI VM with IP address.It will be automatically re-directed to below page by default.If not , you can access the below portal using “https://UI-VM-IP/vcops-vsphere/” .   Login as admin with new password which you have set .

Image may be NSFW.
Clik here to view.
Login page - vCenter Operations Manager

Login page – vCenter Operations Manager

12.Once you have logged in , you will get the home page like below.

Hope this article is informative to you. In the next article ,we will see that how to configure various monitoring elements.

Stay Tuned !!!

Share it ! Comment it !! Be Sociable !!!

The post Configuring the vCenter Operations Manager 5.8 – Part 4 appeared first on UnixArena.

vC Ops Manager 5.8 License Management – Part 5

This article will help you to update the license keys for vCenter operation Manager 5.8 .Once we have deployed the vC Ops ,we need to assign the proper license key to get all the features of the vC Ops. If your product is working on the foundation license mode, it won’t give you any historical data and capacity information which we need desperately. We will see that how we can assign the proper license to vC ops using vSphere web-client .

1. Login to vSphere web-client  and click the Licensing icon which will be under administration tab.

Image may be NSFW.
Clik here to view.
vSphere Web-client - License

vSphere Web-client – License

2.Navigate to the Solutions.Select the “vCenter Operations Manager” and click on “Assign license key”.

3.Select the assign new license key from the drop down.

Image may be NSFW.
Clik here to view.
Assign new License Key for vC ops

Assign new License Key for vC ops

4.Enter the license key which you have purchased from VMware and enter the meaning full name in the Label tab.Click OK

Image may be NSFW.
Clik here to view.
Enter the License Key - vC Ops 5.8

Enter the License Key – vC Ops 5.8

5.You will get the screen like below once your license got updated successfully.

vCenter will update the license information to vC Ops UI VM for every 20 minutes. We can also force the license information to vC Ops using below set of commands.This is required only when you want to change the license keys .

6.Login to vC Ops UIVM console from vSphere web-client by clicking the launch console.

7. From the console login as root and switch to admin using “su – admin” command.

8.Check the current license SKU. We have updated the vC ops license keys for “vCenter Operations Manager 5.5 Enterprise Plus” but it’s not yet reflecting here.

9.Let me update the license information using vcops-admin command.

10.Let me check the license status again.

We can see that license information got updated from vCenter.

11. Let me restart the vcopsadmin service to use the new licensing  features using root user. You will get an error if you try to use the “service” command on “admin” user login.

Image may be NSFW.
Clik here to view.
Restarting the vCopsadmin service

Restarting the vCopsadmin service

We have successfully updated the license information for vC Ops.  Thank you for visiting UnixArena.

Share it ! Comment it !! Be Sociable !!!

The post vC Ops Manager 5.8 License Management – Part 5 appeared first on UnixArena.

GHOST GLIBC LIBRARY VULNERABILITY – Redhat

The another heartbreaking news for Linux administrators and users. The serious vulnerability has been detected on the Linux glibc library and they named this vulnerability as “GHOST” .The GNU C Library (glibc) is an implementation of the standard C library and a core part of the Linux operating system. This vulnerability  allows hackers/attackers to take complete control of the system without knowing the system credentials.This security vulnerability has been tagged to CVE-2015-0235 on the National Vulnerability Database (NVD).This bug has been discovered by the Qualys security researchers .

GHOST is a ‘buffer overflow’ bug affecting the function calls gethostbyname() and gethostbyname2() in the glibc library. This vulnerability allows a remote attacker that is able to make an application call to either of these functions to execute arbitrary code with the permissions of the user running the application.

The first vulnerable version of the GNU C Library is glibc-2.2, released on November 10, 2000. Qualys security researchers identified a number of factors that mitigate the impact of this bug. In particular, they discovered that it was fixed on May 21, 2013 (between the releases of glibc-2.17 and glibc-2.18). Unfortunately, it was not recognized as a security threat; as a result, most stable and long-term-support distributions were left exposed (and still are): Debian 7 (wheezy), Red Hat Enterprise Linux 6 & 7, CentOS 6 & 7,Ubuntu 12.04.

Redhat Linux:

How to identify whether system is vulnerability  or not ?

1. Copy the below script to your system. (Ex: Filename = ghost.sh)

#!/bin/bash
uname -a
cat /etc/redhat-release
echo "Installed glibc version(s)"

rv=0
for glibc_nvr in $( rpm -q --qf '%{name}-%{version}-%{release}.%{arch}\n' glibc ); do
    glibc_ver=$( echo "$glibc_nvr" | awk -F- '{ print $2 }' )
    glibc_maj=$( echo "$glibc_ver" | awk -F. '{ print $1 }')
    glibc_min=$( echo "$glibc_ver" | awk -F. '{ print $2 }')

    echo -n "- $glibc_nvr: "
    if [ "$glibc_maj" -gt 2   -o  \
        \( "$glibc_maj" -eq 2  -a  "$glibc_min" -ge 18 \) ]; then
        # fixed upstream version
        echo 'not vulnerable'
    else
        # all RHEL updates include CVE in rpm %changelog
        if rpm -q --changelog "$glibc_nvr" | grep -q 'CVE-2015-0235'; then
            echo "not vulnerable"
        else
            echo "vulnerable"
            rv=1
        fi
    fi
done

if [ $rv -ne 0 ]; then
    cat <
Please refer to <https://access.redhat.com/articles/1332213> for remediation steps
EOF
fi

exit $rv

2.Make the file as executable.

[UnixArena#  ~]$ chmod +x ghost.sh
[UnixArena#  ~]$ ./ghost.sh

3.Execute the script.

[UnixArena#  ~]$ ./ghost.sh
Vulnerable glibc version <= 2.17-54
Vulnerable glibc version <= 2.5-122
Vulnerable glibc version <= 2.12-1.148
Detected glibc version 2.5 revision 118
This system is vulnerable to CVE-2015-0235. <https://access.redhat.com/security/cve/CVE-2015-0235>
Please refer to <https://access.redhat.com/articles/1332213> for remediation steps
[UnixArena#  ~]$

If the system is not vulnerable , you will get the message like below.

Not vulnerable.

To eliminate the possibility of an exploit on Redhat Linux: (Refer: Redhat support article)

  1. Update the glibc and ncsd packages on your system using the packages released with the following errata:
  2. Restart vulnerable services that use glibc (since so many services use glibc, the safest option is to restart the system).


We just needs to follow the below to address the issue since its requires lot of dependencies.

    # yum clean all
    # yum repolist -v
    # yum update glibc
    # reboot

How to confirm whether system needs to restarted ? (Refer : Man Page)

You can use the below command to check whether the system require reboot after updating the glibc package.

# needs-restarting |wc -l
190

Please add if you find any thing to address this bug promptly.

The post GHOST GLIBC LIBRARY VULNERABILITY – Redhat appeared first on UnixArena.

How to update Oracle Solaris 11.2 – SRU

This article will talk about the Oracle Solaris 11.2 SRU update (Jan 2015).  Oracle’s ultimate goal is to make the Solaris patching like Redhat Linux satellite server patching model. There are some companies would like to stick with the legacy OS patching model instead of going for the IPS patching method(Downloading the OS patch bundle and updating it ). Here we are going to see like the one for Oracle Solaris 11.2 . We can also see that how we can download the patch bundle from oracle support website.

1. Search for “Critical Patch update Solaris” like below. Open the most recent link for new SRU update .

Image may be NSFW.
Clik here to view.
Oracle critical Patch update - Solaris

Oracle critical Patch update – Solaris

2. From the above link, search for “solaris” .  Click the “Oracle and Sun Systems Products Suite” Link.

Image may be NSFW.
Clik here to view.
Oracle critical Patch update - Solaris

Oracle critical Patch update – Solaris

3.Click the link for Solaris 11.

Image may be NSFW.
Clik here to view.
Oracle critical Patch update - Solaris 3

Oracle critical Patch update – Solaris

4.From the above link, search for download key, You can get a link for “MOS”  like below.

Image may be NSFW.
Clik here to view.
Oracle critical Patch update - Solaris 4

Oracle critical Patch update

5. You will get the below webpage , once you click MOS link.

Image may be NSFW.
Clik here to view.
Oracle critical Patch update - Solaris 5

Oracle critical Patch update – Solaris

6. When you click the “Repository” link , You will get the below webpage.

7. When you click “Install guide” , you will get the webpage like below. Download the install guide.

Image may be NSFW.
Clik here to view.
Download Repository installation guide

Download Repository installation guide

8.Copy the all three files to the Solaris 11.2 host.

root@UA-GLOBAL:/var/tmp# ls -lrt
total 5608789
-rwx------   1 root     root     1598639566 Mar 25 21:04 p20293332_1100_Solaris86-64_1of2.zip
-rwx------   1 root     root     1230174884 Mar 25 21:53 p20293332_1100_Solaris86-64_2of2.zip
-rwx------   1 root     root       30331 Mar 25 21:57 p20293333_1100_SOLARIS64.zip
root@UA-GLOBAL:/var/tmp#

9.Unzip the “Install guide” zip file.

root@UA-GLOBAL:/var/tmp# unzip p20293333_1100_SOLARIS64.zip
Archive:  p20293333_1100_SOLARIS64.zip
  inflating: README-zipped-repo.txt
  inflating: install-repo.ksh
  inflating: sol-11_2_6_4_0-incr-repo_md5sums.txt
  inflating: readme_11_2_6_4_0.html
  inflating: readme_11_2_6_4_0.txt
root@UA-GLOBAL:/var/tmp#
root@UA-GLOBAL:/var/tmp# ls -lrt
total 5608973
-rw-r--r--   1 root     root         704 Jan  8 00:51 readme.txt
-rw-r--r--   1 root     root        4031 Jan  8 00:51 README-zipped-repo.txt
-rwxr-xr-x   1 root     root        3096 Jan  8 00:51 README-repo-iso.txt
-rw-r--r--   1 root     root        1625 Jan  8 00:51 NOTICES
-rwxr-xr-x   1 root     root       10837 Jan  8 00:51 install-repo.ksh
-rw-r--r--   1 root     root        3246 Jan  8 00:51 COPYRIGHT
-rw-r--r--   1 root     root         136 Jan  8 00:57 sol-11_2_6_4_0-incr-repo_md5sums.txt
-rwx------   1 root     root     1598639566 Mar 25 21:04 p20293332_1100_Solaris86-64_1of2.zip
-rwx------   1 root     root     1230174884 Mar 25 21:53 p20293332_1100_Solaris86-64_2of2.zip
-rwx------   1 root     root       30331 Mar 25 21:57 p20293333_1100_SOLARIS64.zip
root@UA-GLOBAL:/var/tmp#

10. Create the new SRU update repo on the /export/sol1.2.repo. During this process, both the SRU update file will be merged automatically on the new location.

root@UA-GLOBAL:/var/tmp# ./install-repo.ksh  -c -v -d /export/sol1.2.repo/
Using p20293332_1100_Solaris86-64 files for sol-11_2_6_4_0-incr-repo download.

Comparing checksums of downloaded files...done. Checksums match.

Uncompressing p20293332_1100_Solaris86-64_1of2.zip...done.
Uncompressing p20293332_1100_Solaris86-64_2of2.zip...done.
Repository can be found in /export/sol1.2.repo/.
Initiating repository verification.
pkg://solaris/install-image/solaris-auto-install                  74/560 -

root@UA-GLOBAL:/var/tmp#

11. Check the current publisher .  Here we can see that no publisher has been set.

root@UA-GLOBAL:/var/tmp# pkg publisher
PUBLISHER                   TYPE     STATUS P LOCATION
root@UA-GLOBAL:/var/tmp#

12. Set the solaris publisher with newly created repository path.(Refer Step 10 for path).

root@UA-GLOBAL:/var/tmp# pkg set-publisher -g /export/sol1.2.repo/ solaris
root@UA-GLOBAL:/var/tmp# pkg publisher
PUBLISHER                   TYPE     STATUS P LOCATION
solaris                     origin   online F file:///export/sol1.2.repo/
root@UA-GLOBAL:/var/tmp#

13. Check the BE status using beadm command.

root@UA-GLOBAL:/var/tmp# beadm list
BE      Active Mountpoint Space Policy Created
--      ------ ---------- ----- ------ -------
solaris NR     /          9.61G static 2014-08-21 04:10
root@UA-GLOBAL:/var/tmp#

14. Check the current kernel version.

root@UA-GLOBAL:/var/tmp# pkg list entire
NAME (PUBLISHER)                                  VERSION                    IFO
entire                                            0.5.11-0.175.2.0.0.42.0    i--
root@UA-GLOBAL:/var/tmp# pkg list kernel
NAME (PUBLISHER)                                  VERSION                    IFO
system/kernel                                     0.5.11-0.175.2.0.0.42.2    i--
root@UA-GLOBAL:/var/tmp#

15.Initiate the SRU’s update using the pkg update command. It automatically creates the new BE and updates the new SRU updates to it. It also automatically activates the new BE .

root@UA-GLOBAL:/var/tmp# pkg update
            Packages to remove:   2
           Packages to install:   1
            Packages to update: 167
       Create boot environment: Yes
Create backup boot environment:  No
DOWNLOAD                                PKGS         FILES    XFER (MB)   SPEED
Completed                            170/170     6932/6932  259.6/259.6    0B/s

PHASE                                          ITEMS
Removing old actions                       2543/2543
Installing new actions                     2721/2721
Updating modified actions                  6284/6284
Updating package state database                 Done
Updating package cache                       169/169
Updating image state                            Done
Creating fast lookup database                   Done
Updating package cache                           1/1

A clone of solaris exists and has been updated and activated.
On the next boot the Boot Environment solaris-1 will be
mounted on '/'.  Reboot when ready to switch to this updated BE.

Updating package cache                           1/1
---------------------------------------------------------------------------
NOTE: Please review release notes posted at:

http://www.oracle.com/pls/topic/lookup?ctx=solaris11&id=SERNS

---------------------------------------------------------------------------
root@UA-GLOBAL:/var/tmp#

14. Check the BE status. We can see that new BE will be activated after the reboot.

root@UA-GLOBAL:/var/tmp# beadm list
BE        Active Mountpoint Space  Policy Created
--        ------ ---------- -----  ------ -------
solaris   N      /          5.17M  static 2014-08-21 04:10
solaris-1 R      -          10.84G static 2015-03-26 00:24
root@UA-GLOBAL:/var/tmp#

15.Reboot the system using “init 6″ .

16. After the system reboot,  check the BE status.

root@UA-GLOBAL:~# beadm list
BE        Active Mountpoint Space  Policy Created
--        ------ ---------- -----  ------ -------
solaris   -      -          11.62M static 2014-08-21 04:10
solaris-1 NR     /          11.00G static 2015-03-26 00:24
root@UA-GLOBAL:~#

We can see that new BE “solaris-1″ got activated .

17. check the current SRU version  and kernel release. You can see that SRU version has been changed.

root@UA-GLOBAL:~# pkg list entire
NAME (PUBLISHER)                                  VERSION                    IFO
entire                                            0.5.11-0.175.2.6.0.4.0     i--
root@UA-GLOBAL:~#
root@UA-GLOBAL:~# pkg list kernel
NAME (PUBLISHER)                                  VERSION                    IFO
system/kernel                                     0.5.11-0.175.2.6.0.3.2     i--
root@UA-GLOBAL:~#

We have successfully update the Jan 2015 SRU on solaris 11.2 X86 server.

Thank you for visiting UnixArena.

The post How to update Oracle Solaris 11.2 – SRU appeared first on UnixArena.


Cisco – UCS (Unified Computing System) Part -1

Everybody would have been surprised when CISCO jumped in to the X86 server hardware market in 2009. Since then they are growing rapidly in the server market and now they are one of the  competitive vendors for Dell and HP.  CISCO have chosen the right market where they can demonstrate the network capabilities and implement the innovative thinking. CISCO got the knowledge of X86 hardware when the all the X86 hardware vendors were seeking solution for the blade architecture.

Cisco named their X86 hardware as Unified Computing system(UCS).  Cisco’s main target is to reduce the total ownership cost and improve scalability on the X86 hardware platforms.

How different Cisco UCS X86 servers from other hardware vendors like HP and Dell X86 servers ?

  • UCS blades comes along with fabric interconnects which runs on NX-OS with UCS Manager application. This application helps to manage the whole UCS environment as a single unit.
  • Unlike other hardware vendors , Cisco will never ask you to upgrade the firmware on the systems periodically. Unless you would like to add new functionality or Operation system requires new functionality, you can stay with older version of firmware.
  • Stateless Computing – Which means that none of the UCS blades are encoded with MAC address ,WWN values, IP addresses, UUID, firmware and even server BIOS . These all the items are configured in UCS manager as a service profile and it will be applied to the server whenever required.  Here you can find more information about it.
  • Single UCS manager manages 160 servers with the help of Cisco Fabric Extender Technology (FEX Technology).
  • Cisco also offers UCS central which extends the management across multiple domains of UCS and supports 10,000 UCS servers.

UCS – Manager:

Cisco UCS servers can be classified in to two types.

  1. Cisco C – Series
  2. Cisco B – Series

1. Cisco C – Series.

Cisco C – Series servers are nothing but a rack mountable servers. It has dedicated components unlike the blade servers. UCS manager(Fabric Interconnect) is not comes along with Cisco C-series servers but these servers can be added to it. If you do not have UCS manager , then you have to manage the each rack server using the Cisco Integrated Management central  (CIMC) which is similar to ILOM in sun hardware, DRAC in dell servers and ILO in  HP servers .

2. Cisco B – Series.

Cisco B – series servers are blade servers which comes along with UCS chassis and UCS manager (Fabric Interconnect).  Cisco blades are clearly has advantage over the C- series servers  on the cost and power consumption. UCS manager can be used to manage up to 160 B-series blade servers or C- series with the help of Fabric Extenders. UCS manager is a application which runs on NX-OS operating system(Linux based) and the hardware is based on Cisco Nexus 5000 switch.

Image may be NSFW.
Clik here to view.
CISCO UCS - B - Series

CISCO UCS – B – Series

In the up coming articles ,we are going to see these two type of UCS hardware in more details .

Thank you for Visiting UnixArena.

The post Cisco – UCS (Unified Computing System) Part -1 appeared first on UnixArena.

Cisco UCS – C-Series Server Management – Part 2

In this article ,we will explore more about the Cisco UCS C-series server components and CIMC(Cisco Integrated Management controller). C-series are rack mounted servers and we need to manage using the CIMC unless you have the UCS manager installed on your environment. You have also option to opt the cisco UCS P81E virtual Interface card along with C-series server which can provide up to 128 vNIC’s and vHBA’s. Let’s login to the CIMC console.

1. Open the browser and enter the CIMC IP address with secure http like below.  Login with admin user.

2.Once you have logged in to the server , it will show the server summary and status like below.

On the Actions tab , you will get the below things,

Power On ServerTurns on the server and starts the boot process; this can be observed using the KVM Console
Power Off ServerTurns off the server (the CIMC is still accessible even when the server is off)
Shutdown the ServerThe CIMC will attempt to gracefully shut down the server before turning it off
Power Cycle the ServerTurns the server off, followed by turning the server back on again
Hard Reset the ServerResets the server in a fashion similar to pressing the physical Reset button on the server itself
Launch KVM ConsoleLaunches the KVM Console which allows you to interact with the server as
if you had a physical keyboard, monitor, and mouse connected to the server
Turn Off Locater LEDTurns off the blue blinking LED (the CIMC will NOT automatically turn it off, so don’t
forget to turn it off after you have finished using it)
Turn ON Locater LEDTurns on a bright blue blinking LED on the physical server; useful for determining which
physical server is currently being managed
HelpOpens a popup widow with context-sensitive help information
InfoOpens a popup window displaying the CIMC version number

3. Once you have power on the system and  “Launch KVM console”. You will get the below screen after the POST. (Power On Self Test). At this point , you have many options to select .

  • F2- Enter to the BOIS
  • F6 – Boot Order
  • F12 – PXE Network Boot
  • F8 – CIMC config

4.Click on the VM tab on the top of the KVM console. Here you can attach the ISO images for installation.

Click on the Add image to add the ISO image for OS installation. Check the map in the left side.

Boot order can be modified in the step 3 or in CIMC console  (See the below pic)

Once you have selected the proper boot order for the virtual CD-ROM, installation will automatically kicks. After here , it’s all about VMware ESXi to complete the installation .

Let’s go back to CIMC to explore more about the hardware.

5. Click on the inventory and see the CPU and Memory components on it.

Check out the memory tab too.

There are couple of PCI cards are installed on the system. You can see those card on PCI Adapters tab.

We can see that this system has the UCS VIC P81E PCI card.  In the network adapter tab , you will get more information about this. We will see that in the up coming article.

Thank you for Visiting UnixArena.

The post Cisco UCS – C-Series Server Management – Part 2 appeared first on UnixArena.

Cisco UCS – C-Series Server Administration – Part 3

There are  lot of elements  which we didn’t see in the last article. In this article ,we will see that how to configure the CIMC log (syslog), Virtual KVM settings ,configure the BIOS, Power polices, User management, CIMC network settings. We will also see that how to configure the communication services for CIMC(http,https, ssh). To monitor the host, we also able to configure the SNMP on CIMC. At the end of the article, we will see that how to update the firmware and updating the new certificate in CIMC.

1. Verify the sensor status of the C-series server.If there is any issue with the server sensors , it will be displayed here.

2. Event log can  be viewed by clicking the “system event log”

3.Click on the Remote Presence to configure the virtual KVM console. Here we can configure the number of maximum sessions and remote port.

Image may be NSFW.
Clik here to view.
UCS Remote presence - KVM

UCS Remote presence – KVM

4.Here is the place where you can enable the virtual media.  If you enable the virtual media, you can able to map the local ISO file to the CIMC. (Ex: Mapping the OS ISO files)

Image may be NSFW.
Clik here to view.
UCS virtual Media Properties

UCS virtual Media Properties

5. Serial over LAN option  must be enabled to connect   the CIMC remotely.

Image may be NSFW.
Clik here to view.
UCS Remote Presence - Seriel Over LAN

UCS Remote Presence – Seriel Over LAN

6.Boot order can be defined in BIOS – > Configure Boot order.

7.If you click on the configure BIOS, it will take you to the below window.

Processor related settings can be changed in “Advanced” tab.

Image may be NSFW.
Clik here to view.
UCS Configure BIOS Processor config

UCS Configure BIOS Processor config

Server management port configuration can be found in the last tab of the BIOS menu.

Image may be NSFW.
Clik here to view.
Configure the BIOS server management

Configure the BIOS server management

8. We do have option also to configure the peak power consumption on UCS servers.

9. Click on the “admin” tab . In the user Management , we can able to add the new local users and configure the “Active Directory” to it. We have also option to see the current sessions and “admin” user have access to terminate those sessions if required.

Here is the “Active Directory” tab .

Image may be NSFW.
Clik here to view.
UCS users - Active Directory

UCS users – Active Directory

Here is the “sessions ” tab.

Click on the Page 2 to continue.

The post Cisco UCS – C-Series Server Administration – Part 3 appeared first on UnixArena.

Cisco UCS – P81E Virtual Interface Card – Part 4

In UCS C-Series Rack-Mount Servers , You will get an option to choose the third party vendors network card or Cisco UCS P81 E VIC (Virtual Interface Card).  Cisco UCS P81E Virtual Interface Card is a virtualization-optimized Fibre Channel over Ethernet (FCoE) PCI Express (PCIe) two x 8 10-Gbps adapter.The virtual interface card is a dual-port 10 Gb Ethernet PCIe adapter that can support up to 128 PCIe standards-compliant virtual interfaces, which can be dynamically configured. so that both the interface type  [NIC] or host bus adapter [HBA]) and identity (MAC address and worldwide name [WWN]) are established using just-in-time provisioning. In addition, the Cisco UCS P81E can support network interface virtualization and Cisco VM-FEX technology.Cisco UCS P81E will reduce the TCO through NIC, HBA, cabling, and switch reduction.

Image may be NSFW.
Clik here to view.
CISCO UCS P81E Architecture

CISCO UCS P81E Architecture


Here we will see that , how to create the vNIC and vHBA’s on Cisco UCS – P81E VIC on C-series rack mountable servers.

1. Login to the C-Series Rack mountable server and Navigate to Inventory – > Network Adapters. Here we can see that this machine has installed with UCS VIC P81 E Cisco adapter.

2.On the same window, you can see the below screen on the bottom of the page. This card configuration can be exported to our local machine and imported if required like CIMC configuration.

3.If you click on the vNICs tab , you will get the below screen. If you want to add the new NIC like eth0, select the eth0 and click on clone.

4. Click on Add vNIC to create it.

5.Here we can see that eth2 has been created successfully. The same way you can create up to 128 vNIC and that will be acting like physical NIC to the operating system.

6.Click on the vHBAs tab to see the available HBA ports.

In my system has the old VIC and that will support only two vHBA’s. In the newer cards , you will be able to create up to 128 (vNIC+vHBA) together. This FC cards are based on FCoE.

7. This card will supports the SAN boot.  Select the vHBA and click on the boot table. (Above image). Here i have already added the SAN target WWPN and LUN id.

8.If you would like to change the above value, just select and click on edit.

FC’s Properties has been viewed by clicking the properties tab (Refer step 6).

Image may be NSFW.
Clik here to view.
FC 1 Properties


Hope you have some idea about the Cisco UCS P81 E Adapter after reading this article.  In the upcoming articles ,we will see about the B-Series servers and UCS manager(Fabric Interconnect). Stay tuned.

Thank you for visiting UnixArena.

The post Cisco UCS – P81E Virtual Interface Card – Part 4 appeared first on UnixArena.

Redhat Enterprise Linux 7.0 Installation

Redhat has made a lot of changes in Redhat Enterprise Linux 7.0(RHEL 7) when we compared to the previous versions. These changes likely to remind me that what oracle has done with Solaris 11. Most of the operating system vendors are forced to include many virtualization technologies to support the cloud and Redhat also one among them. Redhat has completely changed the service management , booting process, Firewall and networking in RHEL7. The Redhat Linux enterprise Linux 7’s installation method also got changed little bit but its very simple.  Let’s see that how we can install the REHL 7 .

1. If you would like to install the Redhat Enterprise Linux 7 in to the physical machine , insert the RHEL7 DVD on to the drive and boot from DVD.

2. If you want to install the RHEL 7 on the VMware virtual machine , create the virtual machine with guest operating system as “Other Linux 3.x kernel 64 bit” (If your hyper-visor is not supports RHEL7).

3.When the system is booting from DVD , you will see the message like below.

2. You can skip the media check by pressing the Esc key .

3.Select the language and Continue.

4.Unlike the previous versions, RHEL 7 is not going to waste your time by asking lot of questions. Here is the menu, where you can give the few informations for the installation.

5. Once you click the “INSTALLATION DESTINATION” , you can select the disks for the installation. You have option to add the disk from ISCSI or FC  for SAN boot.  ” Add a Disk ” option will take you there. Here I have selected the Local disk for the installation . Click on “Done”  to continue.

Note: Here i have selected the automatic partitioning.

6. Click on “SOFTWARE SELECTION” . Here I have choosen “Infrastructure server”   and add-on was “virtualization hypervisor”. Click on “Done” to continue.

Image may be NSFW.
Clik here to view.
RHEL 7 Installation 6

7.Click on “Network & Hostname”  (Refer screenshot – step 4) to configure the system network and setting the hostname.  You need to “Turn on” the Ethernet adapter to configure the host in network.  (By clicking the “OFF” button).

Click on “Configure” to set the static IP-address. By Default , it has chosen the DHCP IP address.

Here you can see the IP-address which have been configured in the previous screen.

8.Let’s begin the installation .

9.Configure the root password. Click on “Done” to continue.

10. Once the installation is completed , you need to reboot the system .

11.After the system reboot, you will get the console like below.

We have successfully installed the Redhat Enterprise  Linux  7 Server .

Note: RHEL 7’s default root filesystem is XFS

Hope this information is informative to you . Share it ! Comment it !! Be Sociable !!!

The post Redhat Enterprise Linux 7.0 Installation appeared first on UnixArena.

How to reset the root password on RHEL 7 ?

This article will help you to reset the root password on Redhat enterprise Linux 7 (If you have lost it).  Unlike the previous  version of RHEL releases , REHL 7 brought special attention by bringing the lot of new features  on it.  You need to follow some special instruction on Redhat Enterprise Linux 7 to break the root password since SE-Linux is enabled by default. In RHEL 6 , if you start the system in runlevel 1 , you will get the root prompt to reset the root user password.

Here we will see that how we can recover the lost root password on RHEL 7.

1. Reboot the system .

2. In the grub menu, press escape key to prevent the system from booting. Edit the grub menu by pressing “e” .

Image may be NSFW.
Clik here to view.
RHEL 7  - Reset root password

RHEL 7 – Reset root password

3.Press the arrow keys to get the “linux16″ line and press “end” key. This will take you to the end of the line. Here add ” rd.break  console=tty1 ”  like below. Press control-x to boot the system.

4.You will get the “switch-root” prompt like below.

5. When you boot the system using “rd.break” ,  system will be directly mounted on /sysroot in read-only mode. Let me remount it in read/write mode.

switch_root:/# mount -o remount,rw /sysroot

6. Switch into a chroot jail, where /sysroot is treated as the root of the filesystem tree.

switch_root:/# chroot /sysroot

7.Set the new root password. (please update the CMDB immediately !)

sh-4.2# passwd root
New password: 
Retype new password:
passwd:all authentication tokens updated successfully.

8.By default, SE-Linux will be enabled on RHEL7 . So create a blank file in the name of “.autorelabel” under root.

sh-4.2# touch /.autorelabel

9. Exit from the chroot jail and exit from the initramfs.

10 . System will reboot and perform a full SELinux relabel , then  reboot again.

11. once the system is rebooted, you will be able to login with new root password which you have set it .

Hope this article is informative to you .

Share it !  Comment it !  Be Sociable !!!.

The post How to reset the root password on RHEL 7 ? appeared first on UnixArena.

How to edit the grub on RHEL 7 ?

The default boot loader in Redhat enterprise Linux 7 is grub2(GRand Unified Bootloader2).  The  “grub2″ supports almost all the operating systems. The main configuration file for grub2 is /boot/grub2/grub.cfg.  If you want to make any configuration change on the grub menu , you need to use the utility called “grub2-mkconfig” . If you manually edit the grub.cfg using vi or vim, grub will be corrupted. grub2-mkconfig read the /etc/default/grub file and it displays on the terminal. Here we will see that how we can update/edit the grub.cfg using grub2-mkconfig utility.

1. Login to the RHEL 7 system .

2. Check the current grub2 settings . (Look at only for timed-out )

[root@UnixArena-RHEL7 ~]# cat /boot/grub2/grub.cfg  |grep timeout
if [ x$feature_timeout_style = xy ] ; then
  set timeout_style=menu
  set timeout=5
# Fallback normal timeout code in case the timeout_style feature is
  set timeout=5
[root@UnixArena-RHEL7 ~]#

Here is the default “grub”

[root@UnixArena-RHEL7 ~]# cat /etc/default/grub
GRUB_TIMEOUT=5
GRUB_DISTRIBUTOR="$(sed 's, release .*$,,g' /etc/system-release)"
GRUB_DEFAULT=saved
GRUB_DISABLE_SUBMENU=true
GRUB_TERMINAL_OUTPUT="console"
GRUB_CMDLINE_LINUX="rd.lvm.lv=rhel/root crashkernel=auto  rd.lvm.lv=rhel/swap vconsole.font=latarcyrheb-sun16 vconsole.keymap=us rhgb quiet"
GRUB_DISABLE_RECOVERY="true"
[root@UnixArena-RHEL7 ~]#

3. Edit the /etc/default/grub and set the “GRUB_TIMEOUT=15″ .

[root@UnixArena-RHEL7 ~]# grep TIMEOUT  /etc/default/grub
GRUB_TIMEOUT=15
[root@UnixArena-RHEL7 ~]#

4. Run the grub2-mkconfig to view the current settings. It will not going to over-write the  existing configuration.It just like a dry run before committing the changes.

[root@UnixArena-RHEL7 ~]# grub2-mkconfig
Generating grub configuration file ...

5. Commit the changes to grub.cfg.

[root@UnixArena-RHEL7 ~]# grub2-mkconfig > /boot/grub2/grub.cfg
Generating grub configuration file ...
Found linux image: /boot/vmlinuz-3.10.0-123.el7.x86_64
Found initrd image: /boot/initramfs-3.10.0-123.el7.x86_64.img
Found linux image: /boot/vmlinuz-0-rescue-48314559db574327888736c3905146eb
Found initrd image: /boot/initramfs-0-rescue-48314559db574327888736c3905146eb.img
done
[root@UnixArena-RHEL7 ~]#

6. Let me verify the grub.cfg file. We can  see that timeout has been changed from 5 to 15 seconds.

[root@UnixArena-RHEL7 ~]# cat /boot/grub2/grub.cfg |grep timeout
if [ x$feature_timeout_style = xy ] ; then
  set timeout_style=menu
  set timeout=15
# Fallback normal timeout code in case the timeout_style feature is
  set timeout=15
[root@UnixArena-RHEL7 ~]#

7. Let me reboot my system and verify it .

We have successfully edited the grub.cfg using grub2-mkconfig utility. The same way you can edit the other settings too if required.

Hope this article is informative to you .

Share it !  Comment it !! Be Sociable !!!

The post How to edit the grub on RHEL 7 ? appeared first on UnixArena.


How to create the yum repository on RHEL 7 ?

There is no much difference in package management  in  RHEL 7 when we compared to RHEL 6 . We can set up the yum repository using the DVD or you can dump the DVD contents to the filesystem and set-up it. Later on , you can make that filesystem to be available on other systems using http or ftp to make the current server as yum central repository. In  this article, we will see that how we can setup the yum repository on Redhat Enterprise Linux 7 using the DVD.

1.Login to Redhat Enterprise Linxu 7 . (RHEL7)

2. Create the new directory and mount the RHEL 7 DVD.

[root@UnixArena-RHEL7]# mkdir /rhel7-repo/
[root@UnixArena-RHEL7]# mount /dev/cdrom /rhel7-repo/
[root@UnixArena-RHEL7]# cd  /rhel7-repo/
[root@UnixArena-RHEL7 rhel7-repo ]# ls -lrt
total 812
-r--r--r--.  1 root root  18092 Mar  6  2012 GPL
-r--r--r--.  1 root root   3211 Apr  1  2014 RPM-GPG-KEY-redhat-release
-r--r--r--.  1 root root   3375 Apr  1  2014 RPM-GPG-KEY-redhat-beta
-r--r--r--.  1 root root   8266 Apr  4  2014 EULA
-r--r--r--.  1 root root    108 May  7  2014 media.repo
-r--r--r--.  1 root root   1568 May  7  2014 TRANS.TBL
dr-xr-xr-x.  2 root root   4096 May  7  2014 repodata
dr-xr-xr-x. 24 root root   6144 May  7  2014 release-notes
dr-xr-xr-x.  2 root root 774144 May  7  2014 Packages
dr-xr-xr-x.  2 root root   2048 May  7  2014 LiveOS
dr-xr-xr-x.  2 root root   2048 May  7  2014 isolinux
dr-xr-xr-x.  3 root root   2048 May  7  2014 images
dr-xr-xr-x.  3 root root   2048 May  7  2014 EFI
dr-xr-xr-x.  4 root root   2048 May  7  2014 addons
[root@UnixArena-RHEL7 rhel7-repo]#

3.Navigate to /etc/yum.repos.d/ directory .

4. Create a new file with below contents with extension of “.repo” .

[root@UnixArena-RHEL7 yum.repos.d]# cat unixarena-rhel7.repo
[rhel7_dvd]
gpgcheck = 0
enabled = 1
baseurl = file:///rhel7-repo
name = unixarena-repo
[root@UnixArena-RHEL7 yum.repos.d]#

5. Run “yum clean all”

[root@UnixArena-RHEL7 yum.repos.d]# yum clean all
Loaded plugins: langpacks, product-id, subscription-manager
This system is not registered to Red Hat Subscription Management. You can use subscription-manager to register.
Cleaning repos: rhel7_dvd
Cleaning up everything
[root@UnixArena-RHEL7 yum.repos.d]#

6.Test the new yum repository by installing new package.

[root@UnixArena-RHEL7 yum.repos.d]# yum install telnet
Loaded plugins: langpacks, product-id, subscription-manager
This system is not registered to Red Hat Subscription Management. You can use subscription-manager to register.
rhel7_dvd                                                                                                                                        | 4.1 kB  00:00:00
(1/2): rhel7_dvd/group_gz                                                                                                                        | 134 kB  00:00:00
(2/2): rhel7_dvd/primary_db                                                                                                                      | 3.4 MB  00:00:00
Resolving Dependencies
--> Running transaction check
---> Package telnet.x86_64 1:0.17-59.el7 will be installed
--> Finished Dependency Resolution

Dependencies Resolved

============================================================================================
 Package           Arch          Version        Repository                 Size
============================================================================================
Installing:
 telnet           x86_64         1:0.17-59.el7     rhel7_dvd              63 k

Transaction Summary
============================================================================================
Install  1 Package

Total download size: 63 k
Installed size: 113 k
Is this ok [y/d/N]: y
Downloading packages:
Running transaction check
Running transaction test
Transaction test succeeded
Running transaction
  Installing : 1:telnet-0.17-59.el7.x86_64                                                                                                                          1/1
rhel7_dvd/productid                                                                                                                              | 1.6 kB  00:00:00
  Verifying  : 1:telnet-0.17-59.el7.x86_64                                                                                                                          1/1

Installed:
  telnet.x86_64 1:0.17-59.el7

Complete!
[root@UnixArena-RHEL7 yum.repos.d]#

This test shows that we have successfully configured the Redhat Enterprise Linux 7’s yum repository using the DVD/ISO image.

Share it ! Comment it !! Be Sociable !!!.

The post How to create the yum repository on RHEL 7 ? appeared first on UnixArena.

RHEL 7 – Graphical User Mode(GUI) is not coming ?

When you install the Redhat Enterprise Linux on datacenter, we will be not be installing with gnome packages by default. But in some cases, you may need graphical user mode. So you have to install the gnome packages and it’s dependencies to bring the system in to GUI. In my case , I have installed the RHEL 7 without installing the GNOME packages. Let’s see that how we can bring the system in to the GUI mode and setting the GUI targets permanently.

Assuming that , Your system is already configured with proper yum repository .If not , please do it now.

1. Login to the RHEL7 system.

2. List the available group in the yum repository .

[root@UnixArena-RHEL7 ~]# yum group list
Loaded plugins: langpacks, product-id, subscription-manager
This system is not registered to Red Hat Subscription Management. You can use subscription-manager to register.
There is no installed groups file.
Maybe run: yum groups mark convert (see man yum)
Available environment groups:
   Minimal Install
   Infrastructure Server
   File and Print Server
   Basic Web Server
   Virtualization Host
   Server with GUI
Available Groups:
   Compatibility Libraries
   Console Internet Tools
   Development Tools
   Graphical Administration Tools
   Legacy UNIX Compatibility
   Scientific Support
   Security Tools
   Smart Card Support
   System Administration Tools
   System Management
Done
[root@UnixArena-RHEL7 ~]#

3. Since , we are working on the server, let me install the group called “server with GUI” group.

[root@UnixArena-RHEL7 ~]# yum groupinstall 'Server with GUI'
Loaded plugins: langpacks, product-id, subscription-manager
This system is not registered to Red Hat Subscription Management. You can use subscription-manager to register.
There is no installed groups file.
Maybe run: yum groups mark convert (see man yum)
Package 1:NetworkManager-config-server-0.9.9.1-13.git20140326.4dba720.el7.x86_64 already installed and latest version
Warning: Group core does not have any packages to install.
Warning: Group base does not have any packages to install.
Group base does have 1 conditional packages, which may get installed.
Resolving Dependencies
--> Running transaction check
---> Package ModemManager.x86_64 0:1.1.0-6.git20130913.el7 will be installed
--> Processing Dependency: libmbim-glib.so.0()(64bit) for package: ModemManager-1.1.0-6.git20130913.el7.x86_64
--> Processing Dependency: libqmi-glib.so.1()(64bit) for package: ModemManager-1.1.0-6.git20130913.el7.x86_64
---> Package NetworkManager-libreswan.x86_64 0:0.9.8.0-5.el7 will be installed
<<<<<>>>>>>>
  xorg-x11-server-utils.x86_64 0:7.7-4.el7            xorg-x11-xkb-utils.x86_64 0:7.7-9.1.el7
  yelp-libs.x86_64 1:3.8.1-7.el7                      yelp-xsl.noarch 0:3.8.1-2.el7
  zenity.x86_64 0:3.8.0-4.el7

Complete!
[root@UnixArena-RHEL7 ~]#

4. If you do not want to install all the server management graphical tools, just install the gnome desktop  using the below command.

[root@UnixArena-RHEL7 ~]# yum groupinstall 'X Window System' 'GNOME'

5. In RHEL 7’s init  run-levels are called as targets. (We will discuss about this later). Check the current target on this system using systemctl command.

[root@UnixArena-RHEL7 ~]# systemctl get-default
multiuser.target
[root@UnixArena-RHEL7 ~]#

6.Modify the  target as “graphical.target” to bring the system in to the GUI mode by default.

[root@UnixArena-RHEL7 ~]# systemctl enable graphical.target --force
rm '/etc/systemd/system/default.target'
ln -s '/usr/lib/systemd/system/graphical.target' '/etc/systemd/system/default.target'
[root@UnixArena-RHEL7 ~]#

7.Verify the current target now.

[root@UnixArena-RHEL7 ~]# systemctl get-default
graphical.target
[root@UnixArena-RHEL7 ~]#

8. Reboot the system .

9. Accept  the license agreement and continue.

We have successfully configured the existing RHEL7 server with GUI .

Share it ! Comment it !! Be Sociable !!!

The post RHEL 7 – Graphical User Mode(GUI) is not coming ? appeared first on UnixArena.

Service Management (systemd) – RHEL 7

Prior to Redhat Enterprise Linux 7 operating system, init was the process which is responsible for activating the other services in the system. There were daemons and many system V LSB scripts were started at the boot time. These are mostly likely the shell scripts which resides under the /etc/init.d directory and called on the different run levels. But this system has lot of limitation which has been addressed on RHEL 7, with the new init system called “systemd” . In Redhat Enterprise Linux 7 , Systemd owns the process ID 1 .

Highlights of systemd:

  • It supports the Parallelization  which increases the system boot time.
  • Systemd creates the sockets for each daemons  and it just needs to connect to the sockets.
  • Automatic service dependency management which can prevent long time-outs.
  • A method of tacking related processes together by using Linux control groups.
  • Still RHEL 7 supports the shell scripts  for  few legacy services.(/etc/init.d).

Systemctl :

The systemctl  is a  command to manage the different type of objects. These objects are called “units” . If you would like to know the available units on RHEl 7 , use the below command.

UA-RHEL7#systemctl -t help
Available unit types:
service
socket
target
device
mount
automount
snapshot
timer
swap
path
slice
scope
UA-RHEL7#

In this article ,we will see about the Service units and Socket units.

Service Management with systemctl:

1. To list all the available services on the system, use the below command.

UA-RHEL7#systemctl --type=service
UNIT                               LOAD   ACTIVE SUB     DESCRIPTION
abrt-ccpp.service                  loaded active exited  Install ABRT coredump hook
abrt-oops.service                  loaded active running ABRT kernel log watcher
abrt-xorg.service                  loaded active running ABRT Xorg log watcher
abrtd.service                      loaded active running ABRT Automated Bug Reporting Tool
accounts-daemon.service            loaded active running Accounts Service
<<<<<<some lines are truncated>>>>>>>>
udisks2.service                    loaded active running Disk Manager
upower.service                     loaded active running Daemon for power management

LOAD   = Reflects whether the unit definition was properly loaded.
ACTIVE = The high-level unit activation state, i.e. generalization of SUB.
SUB    = The low-level unit activation state, values depend on unit type.

64 loaded units listed. Pass --all to see loaded but inactive units, too.
To show all installed unit files use 'systemctl list-unit-files'.
UA-RHEL7#

2. To check the specific service status ,

UA-RHEL7#systemctl status upower.service
upower.service - Daemon for power management
   Loaded: loaded (/usr/lib/systemd/system/upower.service; disabled)
   Active: active (running) since Thu 2015-04-16 18:59:46 IST; 5h 9min ago
     Docs: man:upowerd(8)
 Main PID: 1342 (upowerd)
   CGroup: /system.slice/upower.service
           └─1342 /usr/libexec/upowerd

Apr 16 18:59:46 foundation1.example.com systemd[1]: Starting Daemon for power management...
Apr 16 18:59:46 foundation1.example.com systemd[1]: Started Daemon for power management.
UA-RHEL7#

Here is the another example .

UA-RHEL7#systemctl status sshd.service
sshd.service - OpenSSH server daemon
   Loaded: loaded (/usr/lib/systemd/system/sshd.service; enabled)
   Active: active (running) since Thu 2015-04-16 18:59:34 IST; 5h 11min ago
  Process: 882 ExecStartPre=/usr/sbin/sshd-keygen (code=exited, status=0/SUCCESS)
 Main PID: 889 (sshd)
   CGroup: /system.slice/sshd.service
           └─889 /usr/sbin/sshd -D

Apr 16 18:59:34 foundation1.example.com systemd[1]: Started OpenSSH server daemon.
Apr 16 18:59:35 foundation1.example.com sshd[889]: Server listening on 0.0.0.0 port 22.
Apr 16 18:59:35 foundation1.example.com sshd[889]: Server listening on :: port 22.
Apr 16 22:23:27 foundation1.example.com sshd[6842]: Accepted password for root from 172.25.2.190 port 53230 ssh2
UA-RHEL7#

3.To list the active state of all loaded units, use the below command.

UA-RHEL7#systemctl list-units --type=service
UNIT                               LOAD   ACTIVE SUB     DESCRIPTION
abrt-ccpp.service                  loaded active exited  Install ABRT coredump hook
abrt-oops.service                  loaded active running ABRT kernel log watcher
abrt-xorg.service                  loaded active running ABRT Xorg log watcher
abrtd.service                      loaded active running ABRT Automated Bug Reporting Tool
accounts-daemon.service            loaded active running Accounts Service
atd.service                        loaded active running Job spooling tools
auditd.service                     loaded active running Security Auditing Service
avahi-daemon.service               loaded active running Avahi mDNS/DNS-SD Stack

4. To list the active and inactive  state of all loaded units, use the below command.

UA-RHEL7#systemctl list-units --type=service -all 
UNIT                                  LOAD   ACTIVE   SUB     DESCRIPTION
abrt-ccpp.service                     loaded active   exited  Install ABRT coredump hook
abrt-oops.service                     loaded active   running ABRT kernel log watcher
abrt-vmcore.service                   loaded inactive dead    Harvest vmcores for ABRT
abrt-xorg.service                     loaded active   running ABRT Xorg log watcher
abrtd.service                         loaded active   running ABRT Automated Bug Reporting Tool
accounts-daemon.service               loaded active   running Accounts Service
atd.service                           loaded active   running Job spooling tools
auditd.service                        loaded active   running Security Auditing Service
avahi-daemon.service                  loaded active   running Avahi mDNS/DNS-SD Stack
UA-RHEL7#

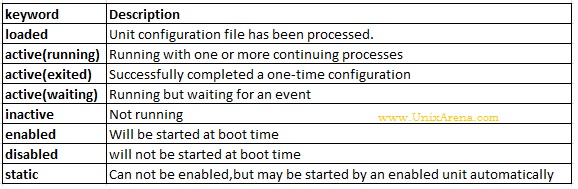
5.The below command will help you that whether  the service will be started automatically  or not .

UA-RHEL7#systemctl list-unit-files --type=service
UNIT FILE                                   STATE
abrt-ccpp.service                           enabled
abrt-oops.service                           enabled
abrt-pstoreoops.service                     disabled
abrt-vmcore.service                         enabled
abrt-xorg.service                           enabled
abrtd.service                               enabled
accounts-daemon.service                     enabled
anaconda-direct.service                     static
anaconda-noshell.service                    static
anaconda-shell@.service                     static
anaconda-sshd.service                       static
anaconda-tmux@.service                      static
anaconda.service                            static
arp-ethers.service                          disabled
atd.service                                 enabled
auditd.service                              enabled
autofs.service                              disabled
autovt@.service                             disabled
avahi-daemon.service                        enabled
Image may be NSFW.
Clik here to view.
service status in RHEL7

service status in RHEL7

6. You can filter the failed services using the systemctl command with below mentioned options.

UA-RHEL7#systemctl --failed --type=service
UNIT          LOAD   ACTIVE SUB    DESCRIPTION
rhnsd.service loaded failed failed LSB: Starts the Spacewalk Daemon

LOAD   = Reflects whether the unit definition was properly loaded.
ACTIVE = The high-level unit activation state, i.e. generalization of SUB.
SUB    = The low-level unit activation state, values depend on unit type.

1 loaded units listed. Pass --all to see loaded but inactive units, too.
To show all installed unit files use 'systemctl list-unit-files'.
UA-RHEL7#

7. To list the all sockets units on the system,

UA-RHEL7#systemctl list-units --type=socket --all
UNIT                         LOAD   ACTIVE   SUB       DESCRIPTION
avahi-daemon.socket          loaded active   running   Avahi mDNS/DNS-SD Stack Activation Socket
dbus.socket                  loaded active   running   D-Bus System Message Bus Socket
dm-event.socket              loaded active   listening Device-mapper event daemon FIFOs
iscsid.socket                loaded active   listening Open-iSCSI iscsid Socket
iscsiuio.socket              loaded active   listening Open-iSCSI iscsiuio Socket
lvm2-lvmetad.socket          loaded active   running   LVM2 metadata daemon socket
rpcbind.socket               loaded active   running   RPCbind Server Activation Socket
syslog.socket                loaded inactive dead      Syslog Socket
systemd-initctl.socket       loaded active   listening /dev/initctl Compatibility Named Pipe
systemd-journald.socket      loaded active   running   Journal Socket
systemd-shutdownd.socket     loaded active   listening Delayed Shutdown Socket
systemd-udevd-control.socket loaded active   running   udev Control Socket
systemd-udevd-kernel.socket  loaded active   running   udev Kernel Socket

LOAD   = Reflects whether the unit definition was properly loaded.
ACTIVE = The high-level unit activation state, i.e. generalization of SUB.
SUB    = The low-level unit activation state, values depend on unit type.

13 loaded units listed.
To show all installed unit files use 'systemctl list-unit-files'.
UA-RHEL7#

Controlling the services with systemctl :

1. Check the crond service status.

UA-RHEL7#systemctl status crond.service
crond.service - Command Scheduler
   Loaded: loaded (/usr/lib/systemd/system/crond.service; enabled)
   Active: active (running) since Thu 2015-04-16 18:59:30 IST; 5h 54min ago
 Main PID: 793 (crond)
   CGroup: /system.slice/crond.service
           └─793 /usr/sbin/crond -n

Apr 16 18:59:30 foundation1.example.com systemd[1]: Started Command Scheduler.
Apr 16 18:59:31 foundation1.example.com crond[793]: (CRON) INFO (RANDOM_DELAY will be scaled with factor 40% if used.)
Apr 16 18:59:31 foundation1.example.com crond[793]: (CRON) INFO (running with inotify support)
UA-RHEL7#

2. To stop the service , use systemctl stop command.

UA-RHEL7#systemctl stop crond.service
UA-RHEL7#systemctl status crond.service
crond.service - Command Scheduler
   Loaded: loaded (/usr/lib/systemd/system/crond.service; enabled)
   Active: inactive (dead) since Fri 2015-04-17 00:56:06 IST; 1s ago
  Process: 793 ExecStart=/usr/sbin/crond -n $CRONDARGS (code=exited, status=0/SUCCESS)
 Main PID: 793 (code=exited, status=0/SUCCESS)

Apr 16 18:59:30 foundation1.example.com systemd[1]: Started Command Scheduler.
Apr 16 18:59:31 foundation1.example.com crond[793]: (CRON) INFO (RANDOM_DELAY will be scaled with factor 40% if used.)
Apr 16 18:59:31 foundation1.example.com crond[793]: (CRON) INFO (running with inotify support)
Apr 17 00:56:06 foundation1.example.com systemd[1]: Stopping Command Scheduler...
Apr 17 00:56:06 foundation1.example.com systemd[1]: Stopped Command Scheduler.
UA-RHEL7#

3.Service can be started back using systemctl start command.

UA-RHEL7#systemctl start crond.service
UA-RHEL7#systemctl status crond.service
crond.service - Command Scheduler
   Loaded: loaded (/usr/lib/systemd/system/crond.service; enabled)
   Active: active (running) since Fri 2015-04-17 01:04:52 IST; 1s ago
 Main PID: 9694 (crond)
   CGroup: /system.slice/crond.service
           └─9694 /usr/sbin/crond -n

Apr 17 01:04:52 foundation1.example.com systemd[1]: Started Command Scheduler.
Apr 17 01:04:52 foundation1.example.com crond[9694]: (CRON) INFO (RANDOM_DELAY will be scaled with factor 41% if used.)
Apr 17 01:04:52 foundation1.example.com crond[9694]: (CRON) INFO (running with inotify support)
Apr 17 01:04:52 foundation1.example.com crond[9694]: (CRON) INFO (@reboot jobs will be run at computer's startup.)
UA-RHEL7#

4.Specific service can be restarted using “systemctl restart” command.

UA-RHEL7#systemctl restart  crond.service
UA-RHEL7#echo $?
0
UA-RHEL7#systemctl status crond.service
crond.service - Command Scheduler
   Loaded: loaded (/usr/lib/systemd/system/crond.service; enabled)
   Active: active (running) since Fri 2015-04-17 01:05:35 IST; 10s ago
 Main PID: 9708 (crond)
   CGroup: /system.slice/crond.service
           └─9708 /usr/sbin/crond -n

5. If you use the restart command , process ID  will be changed. But if you use “reload” option,  it re-reads the configuration without a complete stop and start.  So the process ID remains same.

UA-RHEL7#systemctl status sshd.service |head -8
sshd.service - OpenSSH server daemon
   Loaded: loaded (/usr/lib/systemd/system/sshd.service; enabled)
   Active: active (running) since Thu 2015-04-16 18:59:34 IST; 6h ago
  Process: 882 ExecStartPre=/usr/sbin/sshd-keygen (code=exited, status=0/SUCCESS)
 Main PID: 889 (sshd)
   CGroup: /system.slice/sshd.service
           └─889 /usr/sbin/sshd -D

UA-RHEL7#systemctl reload sshd.service
UA-RHEL7#systemctl status sshd.service |head -8
sshd.service - OpenSSH server daemon
   Loaded: loaded (/usr/lib/systemd/system/sshd.service; enabled)
   Active: active (running) since Thu 2015-04-16 18:59:34 IST; 6h ago
  Process: 9853 ExecReload=/bin/kill -HUP $MAINPID (code=exited, status=0/SUCCESS)
  Process: 882 ExecStartPre=/usr/sbin/sshd-keygen (code=exited, status=0/SUCCESS)
 Main PID: 889 (sshd)
   CGroup: /system.slice/sshd.service
           └─889 /usr/sbin/sshd -D
UA-RHEL7#

6. To see the  service dependency tree , use the below command.

UA-RHEL7#systemctl list-dependencies crond.service
crond.service
├─system.slice
└─basic.target
  ├─microcode.service
  ├─rhel-autorelabel-mark.service
  ├─rhel-autorelabel.service
  ├─rhel-configure.service
  ├─rhel-dmesg.service
  ├─rhel-loadmodules.service
  ├─paths.target
  ├─slices.target
  │ ├─-.slice
  │ └─system.slice
  ├─sockets.target
  │ ├─avahi-daemon.socket
  │ ├─dbus.socket
  │ ├─dm-event.socket
  │ ├─iscsid.socket
  │ ├─iscsiuio.socket
  │ ├─lvm2-lvmetad.socket
  │ ├─rpcbind.socket
  │ ├─systemd-initctl.socket
  │ ├─systemd-journald.socket
  │ ├─systemd-shutdownd.socket
  │ ├─systemd-udevd-control.socket
  │ └─systemd-udevd-kernel.socket
  ├─sysinit.target
  │ ├─dev-hugepages.mount
  │ ├─dev-mqueue.mount
  │ ├─dmraid-activation.service
  │ ├─iscsi.service
  │ ├─kmod-static-nodes.service
  │ ├─lvm2-monitor.service
  │ ├─multipathd.service
  │ ├─plymouth-read-write.service
  │ ├─plymouth-start.service
  │ ├─proc-sys-fs-binfmt_misc.automount
  │ ├─sys-fs-fuse-connections.mount
  │ ├─sys-kernel-config.mount
  │ ├─sys-kernel-debug.mount
  │ ├─systemd-ask-password-console.path
  │ ├─systemd-binfmt.service
  │ ├─systemd-journal-flush.service
  │ ├─systemd-journald.service
  │ ├─systemd-modules-load.service
  │ ├─systemd-random-seed.service
  │ ├─systemd-sysctl.service
  │ ├─systemd-tmpfiles-setup-dev.service
  │ ├─systemd-tmpfiles-setup.service
  │ ├─systemd-udev-trigger.service
  │ ├─systemd-udevd.service
  │ ├─systemd-update-utmp.service
  │ ├─systemd-vconsole-setup.service
  │ ├─cryptsetup.target
  │ ├─local-fs.target
  │ │ ├─-.mount
  │ │ ├─rhel-import-state.service
  │ │ ├─rhel-readonly.service
  │ │ ├─systemd-fsck-root.service
  │ │ └─systemd-remount-fs.service
  │ └─swap.target
  │   ├─dev-disk-by\x2dpath-pci\x2d0000:00:10.0\x2dscsi\x2d0:0:0:0\x2dpart2.swap
  │   ├─dev-disk-by\x2duuid-5926a1d5\x2dc610\x2d4b3a\x2da63b\x2d17dd34a4da6f.swap
  │   ├─dev-disk-by\x2duuid-5926a1d5\x2dc610\x2d4b3a\x2da63b\x2d17dd34a4da6f.swap
  │   └─dev-sda2.swap
  └─timers.target
    └─systemd-tmpfiles-clean.timer
UA-RHEL7#

7. To prevent the service from starting at the boot time , use systemctl disable command.

UA-RHEL7#systemctl disable  crond.service
rm '/etc/systemd/system/multi-user.target.wants/crond.service'
UA-RHEL7#systemctl status  crond.service
crond.service - Command Scheduler
   Loaded: loaded (/usr/lib/systemd/system/crond.service; disabled)
   Active: active (running) since Fri 2015-04-17 01:05:35 IST; 13min ago
 Main PID: 9708 (crond)
   CGroup: /system.slice/crond.service
           └─9708 /usr/sbin/crond -n

The same way , if you want to start the specific service at the system boot time, use systemctl enable command.

UA-RHEL7#systemctl enable  crond.service
ln -s '/usr/lib/systemd/system/crond.service' '/etc/systemd/system/multi-user.target.wants/crond.service'
UA-RHEL7#systemctl status  crond.service
crond.service - Command Scheduler
   Loaded: loaded (/usr/lib/systemd/system/crond.service; enabled)
   Active: active (running) since Fri 2015-04-17 01:05:35 IST; 14min ago
 Main PID: 9708 (crond)
   CGroup: /system.slice/crond.service
           └─9708 /usr/sbin/crond -n

8. To disable the service permanently , use “systemctl mask” command.

UA-RHEL7#systemctl mask crond.service
ln -s '/dev/null' '/etc/systemd/system/crond.service'
UA-RHEL7#systemctl status  crond.service
crond.service
   Loaded: masked (/dev/null)
   Active: active (running) since Fri 2015-04-17 01:05:35 IST; 16min ago
 Main PID: 9708 (crond)
   CGroup: /system.slice/crond.service
           └─9708 /usr/sbin/crond -n

The disabled service will not be started automatically at boot but it can be started manually. A masked service will not be started manually or automatically.

Let me try to stop and start  the service which is masked currently.

UA-RHEL7#systemctl stop  crond.service
UA-RHEL7#systemctl start  crond.service
Failed to issue method call: Unit crond.service is masked.
UA-RHEL7#systemctl status  crond.service
crond.service
   Loaded: masked (/dev/null)
   Active: inactive (dead) since Fri 2015-04-17 01:23:53 IST; 11s ago
 Main PID: 9708 (code=exited, status=0/SUCCESS)

I felt  that systemctl is almost similar to SMF in oracle Solaris 10 /11.

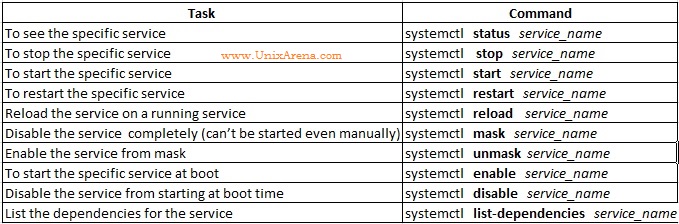
systemctl – cheat sheet:

Hope this  article is informative to you .

Share it ! Comment it !! Be Sociable !!!

The post Service Management (systemd) – RHEL 7 appeared first on UnixArena.

Redhat Enterprise Linux 7 – systemd targets

Redhat Enterprise Linux 7 ‘s booting process also modified lot when you compare to the earlier versions. Instead of grub ,we have grub2 in RHEL 7  to boot the system. The boot loader loads the configured kernel and initramfs from disk to memory. An initramfs  is a gzip-ed cpio archive containing kernel modules for all hardware which required at boot, init scripts and more.  initramfs can be configured in /etc/dracut.conf.

systemctl command can also be used to reboot , powoer-off the system.

Systemd Target:

In Redhat Enterprise Linux 7 , init run levels are replaced by systemd targets.  Still init commands are available , but  in the back-end , it calls the systemd targets to bring the system in to the certain targets .

TargetPurpose
graphical.targetSystem  supports multiple users,graphiacal and text-based logins
multi-user.targetSystem  supports multiple users, text-based logins only
rescue.targetsulogin prompt,basic system initialization completed
emergency.targetsulogin prompt,initramfs pivot complete and system root mounted on /read-only

1. Check the default systemd.target.  (checking default runlevel).

[root@server1-UA ~]#systemctl get-default
multi-user.target
[root@server1-UA ~]#

2.Check the current systemd target(who -r )

[root@server1-UA ~]#systemctl list-units --type=target |grep active |egrep "graphical|multi|resuce|emergency"
multi-user.target   loaded active active Multi-User System
[root@server1-UA ~]#
[root@server1-UA ~]#who -r
         run-level 3  2015-04-18 03:42                   last=5
[root@server1-UA ~]#

3.Change the systemd target to graphical.target (switching to init 5).

[root@server1-UA ~]#systemctl isolate graphical.target
[root@server1-UA ~]#systemctl list-units --type=target |grep active |egrep "graphical|multi|resuce|emergency"
graphical.target    loaded active active Graphical Interface
multi-user.target   loaded active active Multi-User System
[root@server1-UA ~]#who -r
         run-level 5  2015-04-18 03:46                   last=3
[root@server1-UA ~]#

Note: One “systemd target” can be part of another “systemd target”. For an example, graphical systemd target includes multi-user.target and multi-user.target depends on various other targets. You can check the systemd targets dependencies using systemctl list-dependencies command.

Let me check the dependencies for systemd target .

[root@server1-UA ~]#systemctl list-dependencies multi-user.target |grep target
multi-user.target
├─basic.target
│ ├─paths.target
│ ├─slices.target
│ ├─sockets.target
│ ├─sysinit.target
│ │ ├─cryptsetup.target
│ │ ├─local-fs.target
│ │ └─swap.target
│ └─timers.target
├─getty.target
├─nfs.target
└─remote-fs.target
[root@server1-UA ~]#

Here is the available systemd targets on the system.

[root@server1-UA ~]#systemctl list-units --type=target
UNIT                LOAD   ACTIVE SUB    DESCRIPTION
basic.target        loaded active active Basic System
cryptsetup.target   loaded active active Encrypted Volumes
getty.target        loaded active active Login Prompts
graphical.target    loaded active active Graphical Interface
local-fs-pre.target loaded active active Local File Systems (Pre)
local-fs.target     loaded active active Local File Systems
multi-user.target   loaded active active Multi-User System
network.target      loaded active active Network
nfs.target          loaded active active Network File System Server
paths.target        loaded active active Paths
remote-fs.target    loaded active active Remote File Systems
slices.target       loaded active active Slices
sockets.target      loaded active active Sockets
swap.target         loaded active active Swap
sysinit.target      loaded active active System Initialization
timers.target       loaded active active Timers

LOAD   = Reflects whether the unit definition was properly loaded.
ACTIVE = The high-level unit activation state, i.e. generalization of SUB.
SUB    = The low-level unit activation state, values depend on unit type.

16 loaded units listed. Pass --all to see loaded but inactive units, too.
To show all installed unit files use 'systemctl list-unit-files'.
[root@server1-UA ~]#

4.Set the graphical.target as a default target . (Setting default run-level as 5 ).

[root@server1-UA ~]#systemctl set-default graphical.target
rm '/etc/systemd/system/default.target'
ln -s '/usr/lib/systemd/system/graphical.target' '/etc/systemd/system/default.target'
[root@server1-UA ~]#systemctl get-default
graphical.target
[root@server1-UA ~]#

5.Rebooting the system using systemctl. Since we set the default systemd target as “graphical target” , system should come up with that target.

[root@server1-UA ~]#systemctl reboot
Connection to server1 closed by remote host.
Connection to server1 closed.

6.Check the systemd target, once the system is up .

[root@server1-UA ~]#systemctl list-units --type=target |grep active |egrep "graphical|multi|resuce|emergency"
graphical.target    loaded active active Graphical Interface
multi-user.target   loaded active active Multi-User System
[root@server1-UA ~]#

7.If you would like to boot the system with specific target from the grub menu, please follow the below steps.Here I have shown that how to boot the system in to rescue mode.

  • Interrupt the boot loader grub menu count down by pressing escape key .

Image may be NSFW.
Clik here to view.
grub2 menu

  • Use the arrow keys to scroll down and find the line which starts with linux16. press “end” key to reach the end of the line.
  • Append “systemd.unit=rescue.target
  • Press control-X to boot with these changes.

Here you can see that system has been booted in to the rescue mode.

[  OK  ] Reached target System Initialization.
         Starting Rescue Shell...
[  OK  ] Started Rescue Shell.
[  OK  ] Reached target Rescue Mode.
Welcome to rescue mode! Type "systemctl default" or ^D to enter default mode.
Type "journalctl -xb" to view system logs. Type "systemctl reboot" to reboot.
Give root password for maintenance

Use the systemcctl command to list the target status.

[root@server1 ~]# systemctl list-units --type=target -all
UNIT                   LOAD   ACTIVE   SUB    DESCRIPTION
basic.target           loaded inactive dead   Basic System
cryptsetup.target      loaded active   active Encrypted Volumes
emergency.target       loaded inactive dead   Emergency Mode
final.target           loaded inactive dead   Final Step
getty.target           loaded inactive dead   Login Prompts
graphical.target       loaded inactive dead   Graphical Interface
local-fs-pre.target    loaded active   active Local File Systems (Pre)
local-fs.target        loaded active   active Local File Systems
multi-user.target      loaded inactive dead   Multi-User System
network-online.target  loaded inactive dead   Network is Online
network.target         loaded inactive dead   Network
nfs.target             loaded inactive dead   Network File System Server
nss-lookup.target      loaded inactive dead   Host and Network Name Lookups
nss-user-lookup.target loaded inactive dead   User and Group Name Lookups
paths.target           loaded inactive dead   Paths
remote-fs-pre.target   loaded inactive dead   Remote File Systems (Pre)
remote-fs.target       loaded inactive dead   Remote File Systems
rescue.target          loaded active   active Rescue Mode
shutdown.target        loaded inactive dead   Shutdown
slices.target          loaded inactive dead   Slices
sockets.target         loaded inactive dead   Sockets
swap.target            loaded active   active Swap
sysinit.target         loaded active   active System Initialization
syslog.target          not-found inactive dead   syslog.target
time-sync.target       loaded inactive dead   System Time Synchronized
timers.target          loaded inactive dead   Timers
umount.target          loaded inactive dead   Unmount All Filesystems

LOAD   = Reflects whether the unit definition was properly loaded.
ACTIVE = The high-level unit activation state, i.e. generalization of SUB.
SUB    = The low-level unit activation state, values depend on unit type.

27 loaded units listed.
To show all installed unit files use 'systemctl list-unit-files'.
[root@server1 ~]#

If you would like to see the targets which are currently active, use the below command.

roott@server1 ~]# systemctl list-units --type=target -all |grep active |grep -v dead
cryptsetup.target      loaded active   active Encrypted Volumes
local-fs-pre.target    loaded active   active Local File Systems (Pre)
local-fs.target        loaded active   active Local File Systems
rescue.target          loaded active   active Rescue Mode
swap.target            loaded active   active Swap
sysinit.target         loaded active   active System Initialization
[root@server1 ~]#

The above commands confirms that system has been booted into the rescue mode.

System can be bring in to any new target by using systemctl isolate command.

[root@server1 ~]# systemctl isolate multi-user.target
[  991.464879] type=1305 audit(1429346862.537:3): audit_pid=488 old=0 auid=4294967295 ses=4294967295 subj=system_u:system_r:auditd_t:s0 res=1
[  991.669108] systemd-journald[372]: Received request to flush runtime journal from PID 1
[  991.795015] Installing knfsd (copyright (C) 1996 okir@monad.swb.de).
[  996.829590] systemd-journald[372]: Received request to flush runtime journal from PID 1
netcf-transaction.sh[581]: Running  start: No pending transaction to rollback
[  999.417764] ip_tables: (C) 2000-2006 Netfilter Core Team
[  999.870080] nf_conntrack version 0.5.0 (5793 buckets, 23172 max)
[ 1000.072606] ip6_tables: (C) 2000-2006 Netfilter Core Team
[ 1000.643220] Ebtables v2.0 registered
[ 1000.873726] Bridge firewalling registered

server1 login:root
password:
[root@server1-UA ~]#

Hope this article is informative to you .

Share it ! Comment it !! Be sociable !!!

The post Redhat Enterprise Linux 7 – systemd targets appeared first on UnixArena.

RHEL 7 – Networking overview

Redhat has made a lot of changes in the RHEL-7’s networking part. In Red Hat Enterprise Linux 7, the default networking service is provided by NetworkManager, which is a dynamic network control and configuration daemon that attempts to keep network devices and connections up and active when they are available. The traditional ifcfg type configuration files are still supported.  To view the current network configuration, you need to use the command called “ip” . Still “ifconfig” command is operational but moving forward, we may need to use /sbin/ip and nmcli commands. In this article ,we will see that how to review the current network configuration and checking open ports and listening services. 1.To display the current IP address configured on the system, use the below command.

[root@server1-UA ~]#ip add show
1: lo: <LOOPBACK,UP,LOWER_UP> mtu 65536 qdisc noqueue state UNKNOWN
    link/loopback 00:00:00:00:00:00 brd 00:00:00:00:00:00
    inet 127.0.0.1/8 scope host lo
       valid_lft forever preferred_lft forever
    inet6 ::1/128 scope host
       valid_lft forever preferred_lft forever
2: eth0: <BROADCAST,MULTICAST,UP,LOWER_UP> mtu 1500 qdisc pfifo_fast state UP qlen 1000
    link/ether 52:54:00:00:01:0b brd ff:ff:ff:ff:ff:ff
    inet 172.25.2.251/16 brd 172.25.255.255 scope global eth0
       valid_lft forever preferred_lft forever
    inet6 fe80::5054:ff:fe00:10b/64 scope link
       valid_lft forever preferred_lft forever
[root@server1-UA ~]#

2. To see the specific interface IP address on the RHEL-7, use the below mentioned command.

[root@server1-UA ~]#ip add show eth0
2: eth0: <BROADCAST,MULTICAST,UP,LOWER_UP> mtu 1500 qdisc pfifo_fast state UP qlen 1000
    link/ether 52:54:00:00:01:0b brd ff:ff:ff:ff:ff:ff
    inet 172.25.2.251/16 brd 172.25.255.255 scope global eth0
       valid_lft forever preferred_lft forever
    inet6 fe80::5054:ff:fe00:10b/64 scope link
       valid_lft forever preferred_lft forever
[root@server1-UA ~]#

UP – It indicates that interface is Active currently. link/ether – Shows the MAC address of the network card/interface. inet – Show the IPV4 ip-address for the interface , subnet mask and broadcast address. inet6- shows the IPV6 information. 3. To see the specific link statistics , use the IP command.

[root@server1-UA ~]#ip -s link show
1: lo: <LOOPBACK,UP,LOWER_UP> mtu 65536 qdisc noqueue state UNKNOWN mode DEFAULT
    link/loopback 00:00:00:00:00:00 brd 00:00:00:00:00:00
    RX: bytes  packets  errors  dropped overrun mcast
    556        8        0       0       0       0
    TX: bytes  packets  errors  dropped carrier collsns
    556        8        0       0       0       0
2: eth0: <BROADCAST,MULTICAST,UP,LOWER_UP> mtu 1500 qdisc pfifo_fast state UP mode DEFAULT qlen 1000
    link/ether 52:54:00:00:01:0b brd ff:ff:ff:ff:ff:ff
    RX: bytes  packets  errors  dropped overrun mcast
    339864     3299     0       0       0       0
    TX: bytes  packets  errors  dropped carrier collsns
    38372      384      0       0       0       0
[root@server1-UA ~]#

To show the statistics of specific link,

[root@server1-UA ~]#ip -s link show eth0
2: eth0: <BROADCAST,MULTICAST,UP,LOWER_UP> mtu 1500 qdisc pfifo_fast state UP mode DEFAULT qlen 1000
    link/ether 52:54:00:00:01:0b brd ff:ff:ff:ff:ff:ff
    RX: bytes  packets  errors  dropped overrun mcast
    341297     3314     0       0       0       0
    TX: bytes  packets  errors  dropped carrier collsns
    39902      391      0       0       0       0
[root@server1-UA ~]#

4. To view the routing information , use ip route command.

[root@server1-UA ~]#ip route
172.25.0.0/16 dev eth0  proto kernel  scope link  src 172.25.2.251
[root@server1-UA ~]#

5.In RHEL 7 ,You need to use the tracepath command to trace the path to a remote host. Still traceroute command is operational , but tracepath provides the additional information like RTT(Round Trip timing) and MTU(Maximum Transfer Unit).

[root@server1-UA ~]#tracepath 172.25.2.250
 1:  classroom.example.com                                 2.451ms reached
     Resume: pmtu 65535 hops 1 back 64
[root@server1-UA ~]#

6.In RHEL 7 , “ss” command is used to display the socket statistics. “ss” is an just replacement of “netstat” command.

[root@server1-UA ~]#ss -ta
State      Recv-Q Send-Q   Local Address:Port Peer Address:Port
LISTEN     0      100    127.0.0.1:smtp            *:*
LISTEN     0      128            *:sunrpc          *:*
LISTEN     0      128            *:44338           *:*
LISTEN     0      128            *:ssh             *:*
ESTAB      0      0   172.25.2.251:ssh  172.25.2.250:55682
LISTEN     0      100          ::1:smtp           :::*
LISTEN     0      128           :::sunrpc         :::*
LISTEN     0      128           :::47568          :::*
LISTEN     0      128           :::ssh            :::*
[root@server1-UA ~]#

If  the systems are using the network manager , You can use the below mentioned commands to view the network information . 1. To display a list of all connections , use “nmcli con show” command.

[root@server1-UA ~]# nmcli con show
NAME         UUID                                  TYPE            DEVICE
System eth0  5fb06bd0-0bb0-7ffb-45f1-d6edd65f3e03  802-3-ethernet  eth0
[root@server1-UA ~]#

2. To display the specific connection details, use the below command.

[root@server1-UA ~]# nmcli con show
NAME         UUID                                  TYPE            DEVICE
System eth0  5fb06bd0-0bb0-7ffb-45f1-d6edd65f3e03  802-3-ethernet  eth0
[root@server1-UA ~]# nmcli con show "System eth0"
connection.id:                          System eth0
connection.uuid:                        5fb06bd0-0bb0-7ffb-45f1-d6edd65f3e03
connection.interface-name:              eth0
connection.type:                        802-3-ethernet
connection.autoconnect:                 yes
connection.timestamp:                   1429599144
connection.read-only:                   no
connection.permissions:
connection.zone:                        --
connection.master:                      --
connection.slave-type:                  --
connection.secondaries:
connection.gateway-ping-timeout:        0
802-3-ethernet.port:                    --
802-3-ethernet.speed:                   0
802-3-ethernet.duplex:                  --
802-3-ethernet.auto-negotiate:          yes
802-3-ethernet.mac-address:             --
802-3-ethernet.cloned-mac-address:      --
802-3-ethernet.mac-address-blacklist:
802-3-ethernet.mtu:                     auto
802-3-ethernet.s390-subchannels:
802-3-ethernet.s390-nettype:            --
802-3-ethernet.s390-options:
ipv4.method:                            manual
ipv4.dns:                               172.25.2.250
ipv4.dns-search:                        example.com
ipv4.addresses:                         { ip = 172.25.2.251/16, gw = 0.0.0.0 }
ipv4.routes:
ipv4.ignore-auto-routes:                no
ipv4.ignore-auto-dns:                   yes
ipv4.dhcp-client-id:                    --
ipv4.dhcp-send-hostname:                yes
ipv4.dhcp-hostname:                     --
ipv4.never-default:                     no
ipv4.may-fail:                          yes
ipv6.method:                            ignore
ipv6.dns:
ipv6.dns-search:
ipv6.addresses:
ipv6.routes:
ipv6.ignore-auto-routes:                no
ipv6.ignore-auto-dns:                   no
ipv6.never-default:                     no
ipv6.may-fail:                          yes
ipv6.ip6-privacy:                       -1 (unknown)
ipv6.dhcp-hostname:                     --
GENERAL.NAME:                           System eth0
GENERAL.UUID:                           5fb06bd0-0bb0-7ffb-45f1-d6edd65f3e03
GENERAL.DEVICES:                        eth0
GENERAL.STATE:                          activated
GENERAL.DEFAULT:                        no
GENERAL.DEFAULT6:                       no
GENERAL.VPN:                            no
GENERAL.ZONE:                           --
GENERAL.DBUS-PATH:                      /org/freedesktop/NetworkManager/ActiveConnection/0
GENERAL.CON-PATH:                       /org/freedesktop/NetworkManager/Settings/0
GENERAL.SPEC-OBJECT:                    --
GENERAL.MASTER-PATH:                    --
IP4.ADDRESS[1]:                         ip = 172.25.2.251/16, gw = 0.0.0.0
IP4.DNS[1]:                             172.25.2.250
IP6.ADDRESS[1]:                         ip = fe80::5054:ff:fe00:10b/64, gw = ::
[root@server1-UA ~]#

3.To display the Ethernet status/device status, use “nmcli dev status” command.

[root@server1-UA ~]#nmcli dev status
DEVICE  TYPE      STATE      CONNECTION
eth0    ethernet  connected  System eth0
lo      loopback  unmanaged  --
[root@server1-UA ~]#

4. To check the specific device status in detail, use the below command.

[root@server1-UA ~]#nmcli dev show eth0
GENERAL.DEVICE:                         eth0
GENERAL.TYPE:                           ethernet
GENERAL.HWADDR:                         52:54:00:00:01:0B
GENERAL.MTU:                            1500
GENERAL.STATE:                          100 (connected)
GENERAL.CONNECTION:                     System eth0
GENERAL.CON-PATH:                       /org/freedesktop/NetworkManager/ActiveConnection/0
WIRED-PROPERTIES.CARRIER:               on
IP4.ADDRESS[1]:                         ip = 172.25.2.251/16, gw = 0.0.0.0
IP4.DNS[1]:                             172.25.2.250
IP6.ADDRESS[1]:                         ip = fe80::5054:ff:fe00:10b/64, gw = ::
[root@server1-UA ~]#

Hope this article is informative to you . In the next article, we will see that how to create the network connections using nmcli.

The post RHEL 7 – Networking overview appeared first on UnixArena.

Viewing all 369 articles
Browse latest View live


<script src="https://jsc.adskeeper.com/r/s/rssing.com.1596347.js" async> </script>